Automated Data Plotter
This application dynamically generates many types of graphs derived from various IEM data sources. Feel free to use these generated graphics in whatever way you wish.
1 Select a Chart Type
2 Configure Chart Options
Plot Description:
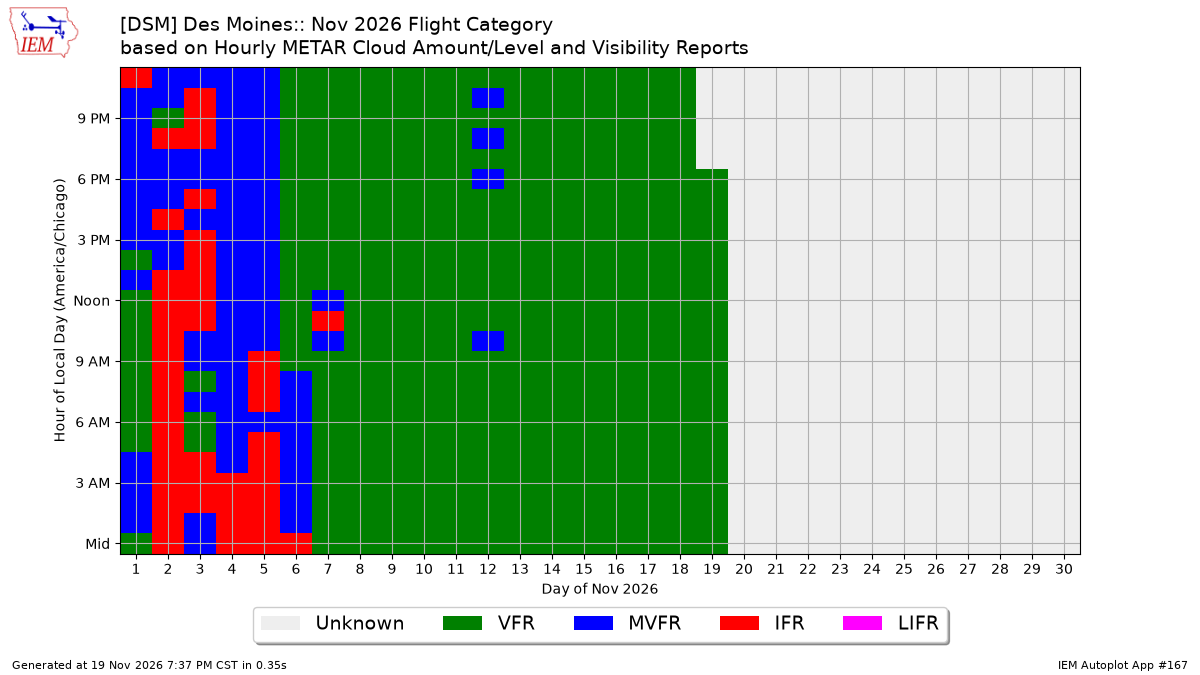
This chart summarizes Flight Category by hour and day of a given month. In the case of multiple observations for a given hour, the worst category is plotted.| code | Label | Description |
|---|---|---|
| Unknown | Unknown | No report or missing visibility for that hour |
| VFR | Visual Flight Rules | Ceiling > 3000' AGL and visibility > 5 statutes miles (green) |
| MVFR | Marginal Visual Flight Rules | 1000-3000' ceilings and/or 3-5 statute miles, inclusive (blue) |
| IFR | Instrument Fight Rules | 500 - < 1000' ceilings and/or 1 to < 3 statute miles (red) |
| LIFR | Low Instrument Flight Rules | < 500' AGL ceilings and/or < 1 mile (magenta) |
Updated 16 Nov 2026: Improvements were made to the flight rule assignment algorithm resulting in slight differences with the generated result. There is some ambiguity with certain cloud and visibility combinations that are now better matched to FAA AIM Chapter 7 Section 1.
3 Generated Chart
Based on recent timings, plot generation averages 2 seconds. Please wait while your chart is being generated...
IEM Daily Features using this plot
The IEM Daily Features found on this website often utilize plots found on this application. Here is a listing of features referencing this plot type.
- 01 May 2026: April Flight Rules
- 01 Jul 2024: June Flight Rules
- 22 Mar 2022: March Flight Rules
- 19 May 2020: Recent Cloudiness
- 17 Sep 2018: September Flight Rules
- 22 Nov 2017: November Flight Categories
- 15 Nov 2016: Nearly All VFR